The charts below show taxable property values by category for tax year 2014, in addition to changes from tax year 2004 to tax year 2014, as reported in annual School and Appraisal Districts' Property Value Study reports. The values reported in the annual Study by the Texas Comptroller of Public Accounts are used by the Texas Education Agency for Foundation School Program (FSP) state aid calculations and distributions of state revenues to school districts. As explained in the Texas Education Agency publication School Finance 101: Funding of Texas Public Schools (Revised October 2014), increases in local property values were offset, in most instances, by decreases in state aid revenues during each state funding biennium in accordance with Foundation School Program state aid calculation provisions in the Education Code.
According to the chart below, homeowners were the primary source of local property tax revenues received by Texas public schools. The amount of local revenues Texas public schools received from homeowners disproportionately exceeded the amounts from all other categories of taxable property.

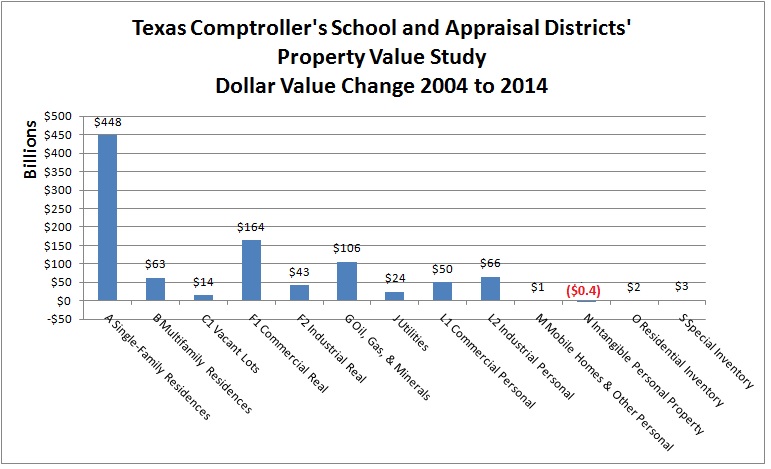
Homeowners experienced an increase of $448 billion in taxable property values from tax year 2004 to 2014, the greatest for any category of taxable property, according to the chart below. Whereas, owners of intangible personal property experienced a change in taxable values of negative ($465) million, from tax year 2004 to 2014. The chart below presents those categories of taxable property for which longitudinal values were available.
When viewed according to percentage change from tax year 2004 to 2014, the Oil, Gas and Minerals category experienced an increase that was slightly more than 200%, the greatest for any category of taxable property. Whereas, owners of intangible personal property experienced a nearly total exemption from property taxes (only $46 thousand in taxable value was reported in tax year 2014, down from $465 million in tax year 2004). The chart below presents those categories of taxable property for which longitudinal values were available.

The publication Texas Property Tax Assistance Property Classification Guide Reports of Property Value, published by Glenn Hagar, Texas Comptroller of Public Accounts, explains what types of properties are included in the categories of taxable values shown in the charts above.
To access the publication Texas Property Tax Assistance Property Classification Guide Reports of Property Value, click on the link below.
http://comptroller.texas.gov/taxinfo/proptax/pdf/96-313.pdf
To access the Texas Education Agency publication School Finance 101: Funding of Texas Public Schools (Revised October 2014) for an explanation of how taxable property values are used by the Texas Education Agency to calculate state revenue distributions to Texas public schools, click on the link below.
http://tea.texas.gov/Finance_and_Grants/State_Funding/Manuals/School__Finance_Manuals/
To access Texas Comptroller's Property Value Study 2014 Preliminary Findings, click on the link below.
http://comptroller.texas.gov/taxinfo/proptax/pvs04f/
To access Texas Comptroller's Property Value Study 2004 Final Findings, click on the link below.
http://comptroller.texas.gov/propertytax/administration/pvs/findings/2014p/